

MySQLのチューニングに役立つツールについてまとめています。
目次
MySQLのサーバパラメータチューニングに使えるツール

MySQLのサーバパラメータを調整するには、診断ツールの出力した内容をもとに、一つ一つパラメータを変更し、動作を検証していくのが良いでしょう。
同時に複数のパラメータを変更して不具合が出た場合、どのパラメータが原因となったのかを突き止めるのに多くの時間がかかります。
phpMyAdminでチューニングすべきポイントがわかる
MySQLの管理ツールとして有名なphpMyAdminは、強力な診断機能を備えています。
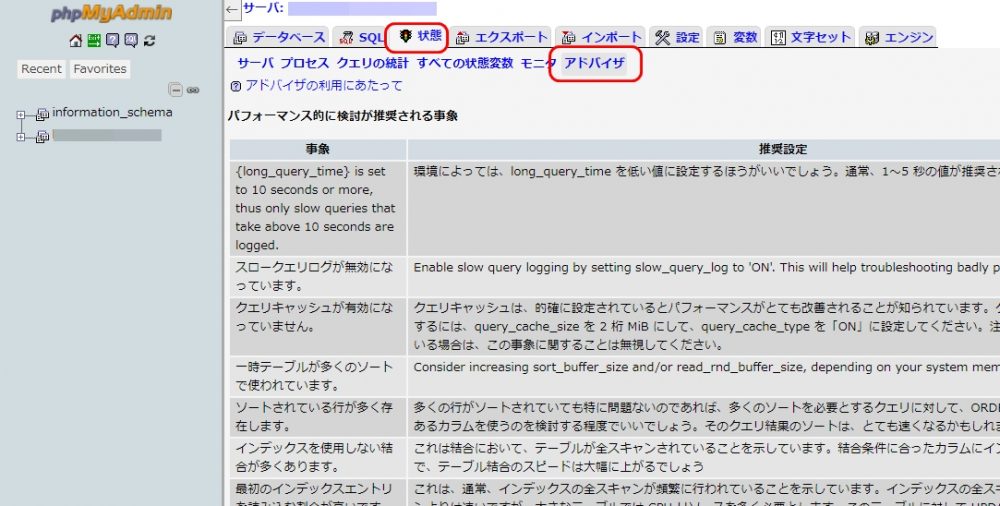
phpMyAdminを開き、状態→アドバイザを指定すると、問題があると思われる事象と、推奨設定が表示されます。特にメモリに関する設定は、パフォーマンスに与える影響が大きいため、重点的にチェックすると良いでしょう。
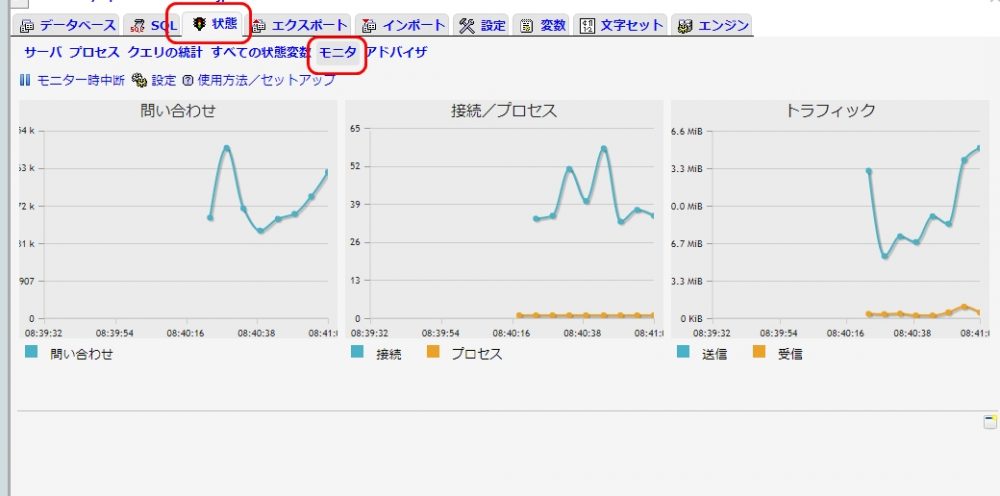
また、状態→モニタで、実行されているクエリ数、接続・プロセス数、トラフィックがリアルタイムにグラフ表示されます。
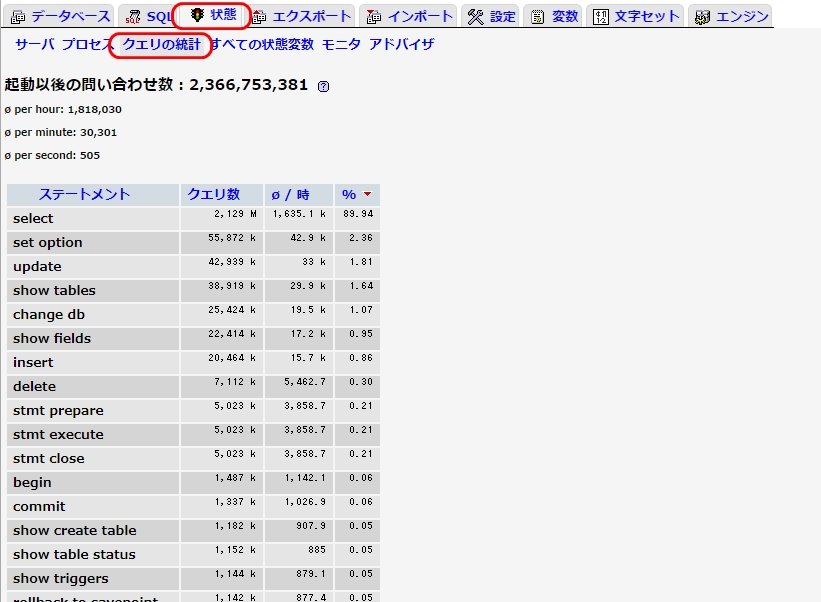
状態→クエリの統計では、より詳細なクエリの統計情報が確認できます。
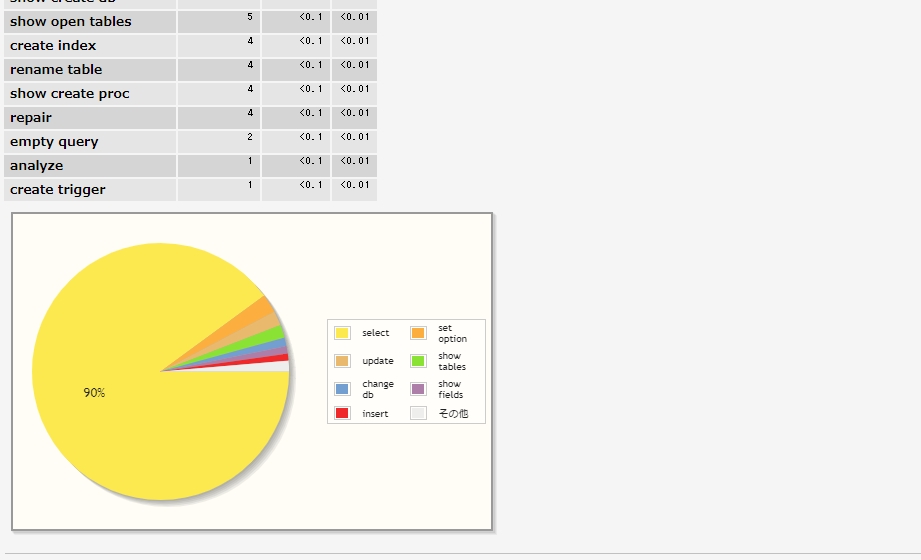
少し下にスクロールさせると、円グラフ表示が確認できます。この例では、90%をselect文が占めていることがわかります。
コマンドラインで使えるチューニングツール MySQL Tuner
MySQL Tunerは、古くから使われているコマンドラインのMySQL診断ツールです。最新のMySQL 8や、派生データベースのMariaDBにも対応しています。
利用するには、githubからダウンロードし、zipファイルを解凍します。
$ wget https://github.com/major/MySQLTuner-perl/archive/master.zip
--2020-01-25 22:55:08--  https://github.com/major/MySQLTuner-perl/archive/master.zip
Resolving github.com (github.com)... 192.30.253.113
 :
 :
$ unzip master.zip
Archive:  master.zip
0b66c2338736779e3b150c7d125b1012d95a961f
 :
 :
$ ls
MySQLTuner-perl-master  master.zip
コマンド本体は、解凍後にできる./MySQLTuner-perl-master/mysqltuner.pl になります。以下のように実行します。
実行時に–helpを付加すると、コマンドラインオプションのヘルプが表示されます。
$ ./MySQLTuner-perl-master/mysqltuner.pl --user root --pass 'my-secret-pw'
 >>  MySQLTuner 1.7.19 - Major Hayden <major@mhtx.net>
 >>  Bug reports, feature requests, and downloads at http://mysqltuner.com/
 >>  Run with '--help' for additional options and output filtering

[--] Skipped version check for MySQLTuner script
[OK] Logged in using credentials passed on the command line
[OK] Currently running supported MySQL version 8.0.19
[OK] Operating on 64-bit architecture

-------- Log file Recommendations ------------------------------------------------------------------
[OK] Log file /var/lib/mysql/instance-2.err exists
[--] Log file: /var/lib/mysql/instance-2.err(1K)
[OK] Log file /var/lib/mysql/instance-2.err is readable.
[OK] Log file /var/lib/mysql/instance-2.err is not empty
[OK] Log file /var/lib/mysql/instance-2.err is smaller than 32 Mb
[!!] /var/lib/mysql/instance-2.err contains 3 warning(s).
[OK] /var/lib/mysql/instance-2.err doesn't contain any error.
[--] 2 start(s) detected in /var/lib/mysql/instance-2.err
[--] 1) 2020-01-17T03:58:41.454119Z 0 [System] [MY-011323] [Server] X Plugin ready for connections. Socket: '/var/run/mysqld/mysqlx.sock'
[--] 2) 2020-01-17T03:58:41.367719Z 0 [System] [MY-010931] [Server] /usr/sbin/mysqld: ready for connections. Version: '8.0.19'  socket: '/var/run/mysqld/mysqld.sock'  port: 0  MySQL Community Server - GPL.
[--] 1 shutdown(s) detected in /var/lib/mysql/instance-2.err
[--] 1) 2020-01-17T03:58:46.647442Z 0 [System] [MY-010910] [Server] /usr/sbin/mysqld: Shutdown complete (mysqld 8.0.19)  MySQL Community Server - GPL.

-------- Storage Engine Statistics -----------------------------------------------------------------
[--] Status: +ARCHIVE +BLACKHOLE +CSV -FEDERATED +InnoDB +MEMORY +MRG_MYISAM +MyISAM +PERFORMANCE_SCHEMA
[--] Data in InnoDB tables: 293.6M (Tables: 13)
[OK] Total fragmented tables: 0

-------- Analysis Performance Metrics --------------------------------------------------------------
[--] innodb_stats_on_metadata: OFF
[OK] No stat updates during querying INFORMATION_SCHEMA.

-------- Security Recommendations ------------------------------------------------------------------
[--] Skipped due to unsupported feature for MySQL 8

-------- CVE Security Recommendations --------------------------------------------------------------
[--] Skipped due to --cvefile option undefined

-------- Performance Metrics -----------------------------------------------------------------------
[--] Up for: 7m 6s (105 q [0.246 qps], 44 conn, TX: 252K, RX: 10K)
[--] Reads / Writes: 100% / 0%
[--] Binary logging is enabled (GTID MODE: OFF)
[--] Physical Memory     : 1.7G
[--] Max MySQL memory    : 9.8G
[--] Other process memory: 0B
[--] Total buffers: 168.0M global + 65.1M per thread (151 max threads)
[--] P_S Max memory usage: 72B
[--] Galera GCache Max memory usage: 0B
[OK] Maximum reached memory usage: 233.1M (13.78% of installed RAM)
[!!] Maximum possible memory usage: 9.8G (591.28% of installed RAM)
[!!] Overall possible memory usage with other process exceeded memory
[OK] Slow queries: 0% (0/105)
[OK] Highest usage of available connections: 0% (1/151)
[OK] Aborted connections: 2.27%  (1/44)
[--] Query cache have been removed in MySQL 8
[OK] Sorts requiring temporary tables: 0% (0 temp sorts / 9 sorts)
[!!] Joins performed without indexes: 2
[OK] Temporary tables created on disk: 0% (0 on disk / 16 total)
[OK] Thread cache hit rate: 97% (1 created / 44 connections)
[OK] Table cache hit rate: 79% (313 open / 393 opened)
[OK] table_definition_cache(2000) is upper than number of tables(326)
[OK] Open file limit used: 0% (6/1M)
[OK] Table locks acquired immediately: 100% (8 immediate / 8 locks)
[OK] Binlog cache memory access: 0% (0 Memory / 0 Total)

-------- Performance schema ------------------------------------------------------------------------
[--] Memory used by P_S: 72B
[--] Sys schema is installed.

-------- ThreadPool Metrics ------------------------------------------------------------------------
[--] ThreadPool stat is disabled.

-------- MyISAM Metrics ----------------------------------------------------------------------------
[--] MyISAM Metrics are disabled on last MySQL versions.

-------- InnoDB Metrics ----------------------------------------------------------------------------
[--] InnoDB is enabled.
[--] InnoDB Thread Concurrency: 0
[OK] InnoDB File per table is activated
[!!] InnoDB buffer pool / data size: 128.0M/293.6M
[!!] Ratio InnoDB log file size / InnoDB Buffer pool size (75 %): 48.0M * 2/128.0M should be equal to 25%
[OK] InnoDB buffer pool instances: 1
[--] Number of InnoDB Buffer Pool Chunk : 1 for 1 Buffer Pool Instance(s)
[OK] Innodb_buffer_pool_size aligned with Innodb_buffer_pool_chunk_size & Innodb_buffer_pool_instances
[OK] InnoDB Read buffer efficiency: 92.22% (27008 hits/ 29288 total)
[!!] InnoDB Write Log efficiency: 88.42% (733 hits/ 829 total)
[OK] InnoDB log waits: 0.00% (0 waits / 96 writes)

-------- AriaDB Metrics ----------------------------------------------------------------------------
[--] AriaDB is disabled.

-------- TokuDB Metrics ----------------------------------------------------------------------------
[--] TokuDB is disabled.

-------- XtraDB Metrics ----------------------------------------------------------------------------
[--] XtraDB is disabled.

-------- Galera Metrics ----------------------------------------------------------------------------
[--] Galera is disabled.

-------- Replication Metrics -----------------------------------------------------------------------
[--] Galera Synchronous replication: NO
[--] No replication slave(s) for this server.
[--] Binlog format: ROW
[--] XA support enabled: ON
[--] Semi synchronous replication Master: Not Activated
[--] Semi synchronous replication Slave: Not Activated
[--] This is a standalone server

-------- Recommendations ---------------------------------------------------------------------------
General recommendations:
    Control warning line(s) into /var/lib/mysql/instance-2.err file
    MySQL was started within the last 24 hours - recommendations may be inaccurate
    Reduce your overall MySQL memory footprint for system stability
    Dedicate this server to your database for highest performance.
    We will suggest raising the 'join_buffer_size' until JOINs not using indexes are found.
             See https://dev.mysql.com/doc/internals/en/join-buffer-size.html
             (specially the conclusions at the bottom of the page).
    Before changing innodb_log_file_size and/or innodb_log_files_in_group read this: https://bit.ly/2TcGgtU
Variables to adjust:
  *** MySQL's maximum memory usage is dangerously high ***
  *** Add RAM before increasing MySQL buffer variables ***
    join_buffer_size (> 256.0K, or always use indexes with JOINs)
    innodb_buffer_pool_size (>= 293.6M) if possible.
    innodb_log_file_size should be (=16M) if possible, so InnoDB total log files size equals to 25% of buffer pool size.
[!!]の項目を中心に、チューニングを行っていきます。スクリプトさえあれば、即診断できるのでお手軽なのですが、どのようにチューニングをすればよいのかが分からないというデメリットが有ります。
MySQLTunerを使ったMySQLのチューニングを業務にしている会社もあるぐらいなので、この状態だけを元にチューニングを行うのは相当なMySQLの知識が要求されるでしょう。
SQLのチューニングは、explainを使っておこなう

アプリケーション等で使われるSQLの最初に「explain」を付与して実行すると、実行計画が確認できます。
mysql> explain select * from employees order by first_name;
+----+-------------+-----------+------------+------+---------------+------+---------+------+--------+----------+----------------+
| id | select_type | table     | partitions | type | possible_keys | key  | key_len | ref  | rows   | filtered | Extra          |
+----+-------------+-----------+------------+------+---------------+------+---------+------+--------+----------+----------------+
|  1 | SIMPLE      | employees | NULL       | ALL  | NULL          | NULL | NULL    | NULL | 299246 |   100.00 | Using filesort |
+----+-------------+-----------+------------+------+---------------+------+---------+------+--------+----------+----------------+
1 row in set, 1 warning (0.00 sec)

mysql> explain select * from employees order by emp_no;
+----+-------------+-----------+------------+-------+---------------+---------+---------+------+--------+----------+-------+
| id | select_type | table     | partitions | type  | possible_keys | key     | key_len | ref  | rows   | filtered | Extra |
+----+-------------+-----------+------------+-------+---------------+---------+---------+------+--------+----------+-------+
|  1 | SIMPLE      | employees | NULL       | index | NULL          | PRIMARY | 4       | NULL | 299246 |   100.00 | NULL  |
+----+-------------+-----------+------------+-------+---------------+---------+---------+------+--------+----------+-------+
1 row in set, 1 warning (0.00 sec)
typeの項目がALLになっているSQLは、テーブルフルスキャンが行われていることを示しています。適切なindexを付与し、実行速度を向上させましょう。
複数テーブルのjoinを行っているSQLでソートを行う場合、指定するカラムによって速度が激変する場合もあります。
【関連記事】
▶SQL Joinサンプル集 Joinで遅いSQLの原因を調べる方法
まとめ


- MySQLサーバチューニングには、phpMyAdminのアドバイザ情報が便利
- MySQL Tunerは手軽に使えるが、チューニングには知識が必要
- 個別のSQLは、explainを使ってチューニングすべき点を調べる